01
Membrane packing
Area per lipid quantifies the average lateral area available to one lipid in a leaflet.

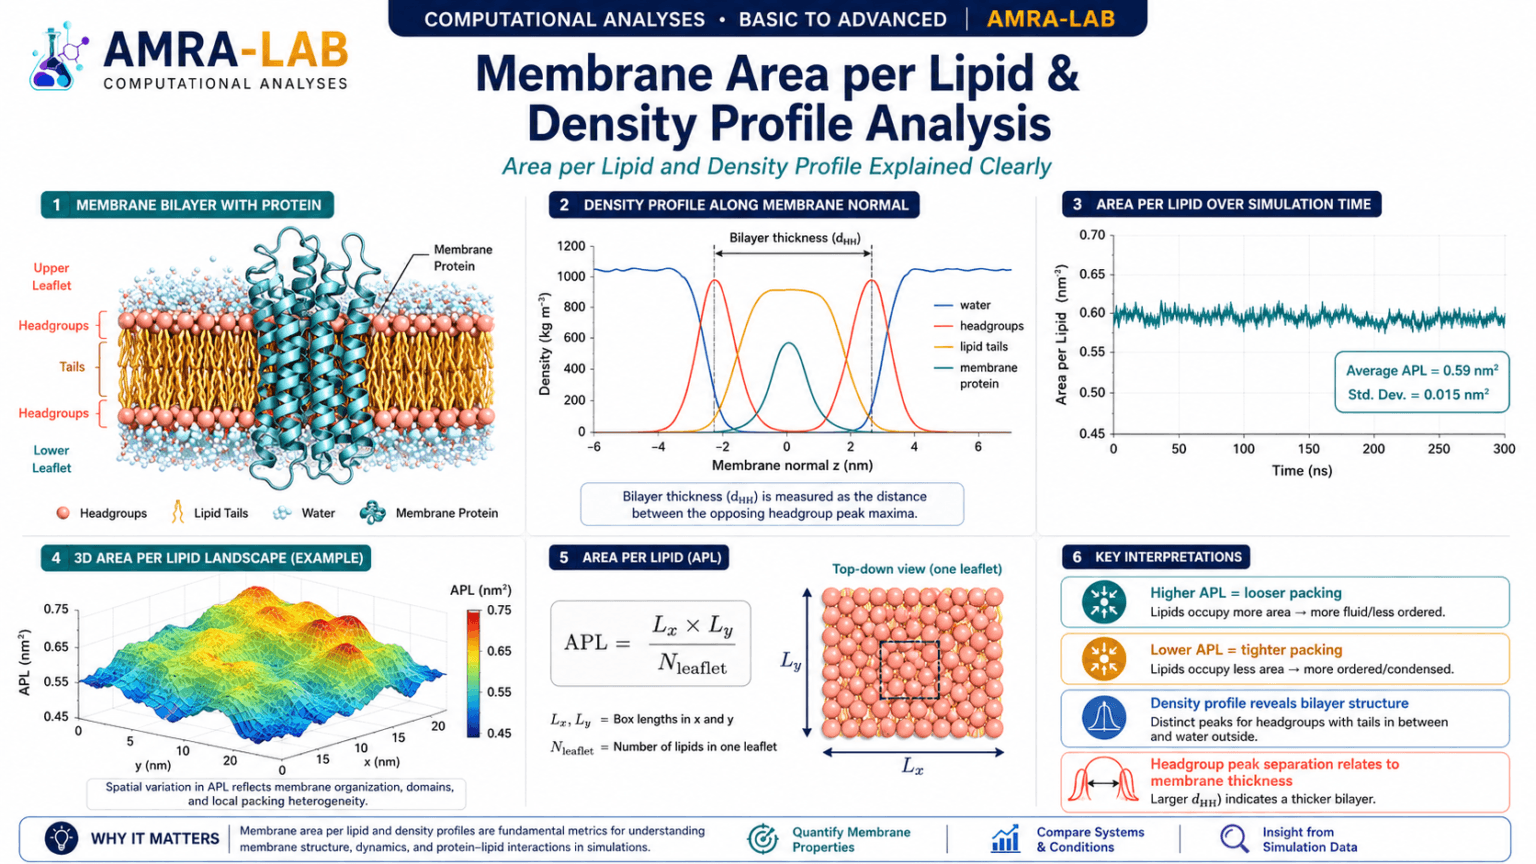
A practical guide to membrane packing, leaflet organization, bilayer thickness, component distributions, protein insertion, and structural equilibration after molecular dynamics simulation.
Area per lipid quantifies the average lateral area available to one lipid in a leaflet.
Density profiles show where lipid heads, tails, water, ions, and proteins are distributed along the membrane normal.
Together, APL and density profiles help assess membrane relaxation, thickness, symmetry, and insertion.
APL is the projected membrane area in the xy plane divided by the number of lipids in one leaflet. It describes lateral lipid packing.
A density profile shows how selected components are distributed along x, y, or usually z, the membrane-normal direction.
Low APL indicates tighter lateral packing; high APL indicates looser packing or greater expansion.
The distance between opposing headgroup-density peaks provides an operational membrane-thickness estimate.
Protein and lipid density overlap helps locate transmembrane domains and detect asymmetric insertion.
For a membrane normal along z, calculate Axy = Lx × Ly for every trajectory frame.
For a symmetric bilayer with N total lipids, Nleaflet is often N/2. Asymmetric bilayers require separate counts.
In membrane-protein systems, naive box area divided by lipid count can overestimate lipid area because part of the xy plane is occupied by protein.
Report the mean, standard deviation, block uncertainty, and analyzed time interval.
Center the membrane for each frame to prevent bilayer drift from smearing the profile.
Most bilayers are aligned with z, but the correct axis must match the actual membrane orientation.
Mass, number, charge, or electron density is accumulated in thin slabs along the selected axis.
The final curve represents the time-averaged spatial distribution of each selected component.
| Feature | Typical meaning | Important caution | বাংলা |
|---|---|---|---|
| Two headgroup peaks | Opposing leaflets and bilayer thickness | Peak position depends on selected headgroup atoms | দুই leaflet-এর অবস্থান |
| Tail maximum near center | Hydrophobic core | Tail-group selection changes profile width | Membrane-এর hydrophobic core |
| Water minimum at center | Low water penetration | Nonzero water may indicate pores or defects | Center-এ পানি কম থাকা |
| Protein overlap | Insertion depth and transmembrane span | Global averaging can hide local tilt | Protein কোথায় inserted |
| Asymmetric peaks | Leaflet asymmetry, composition, curvature, or insertion | Could also arise from insufficient centering | Leaflet asymmetry |
gmx energy -f md.edr -o box_xy.xvg
# Select Box-X and Box-Y, then calculate Axy(t) = Box-X(t) × Box-Y(t)
# APL(t) = Axy(t) / Nlipids_per_leaflet
A small Python, R, spreadsheet, or Grace workflow can multiply Box-X and Box-Y frame-by-frame and divide by the correct leaflet lipid count.
gmx trjconv -s md.tpr -f md.xtc -o membrane_centered.xtc -pbc mol -center

gmx density -s md.tpr -f membrane_centered.xtc -n index.ndx \
  -o density_z.xvg -d Z -sl 200 -dens mass -center
Use suitable index groups for water, lipid headgroups, tails, ions, and protein. The current GROMACS documentation notes that centering is especially important for bilayers because box and membrane fluctuations can smear density profiles.
Area per lipid measures lateral membrane packing, while density profiles measure spatial organization across the membrane normal. Together they provide complementary evidence for bilayer equilibration, thickness, symmetry, insertion, and structural response—but neither should be interpreted without membrane composition, simulation conditions, and supporting analyses.
Educational content for AMRA-LAB Computational Analyses · Membrane APL and Density Profile module