01
Force vs Time
Shows when resistance, rupture, rearrangement, or relaxation occurs during the pulling trajectory.

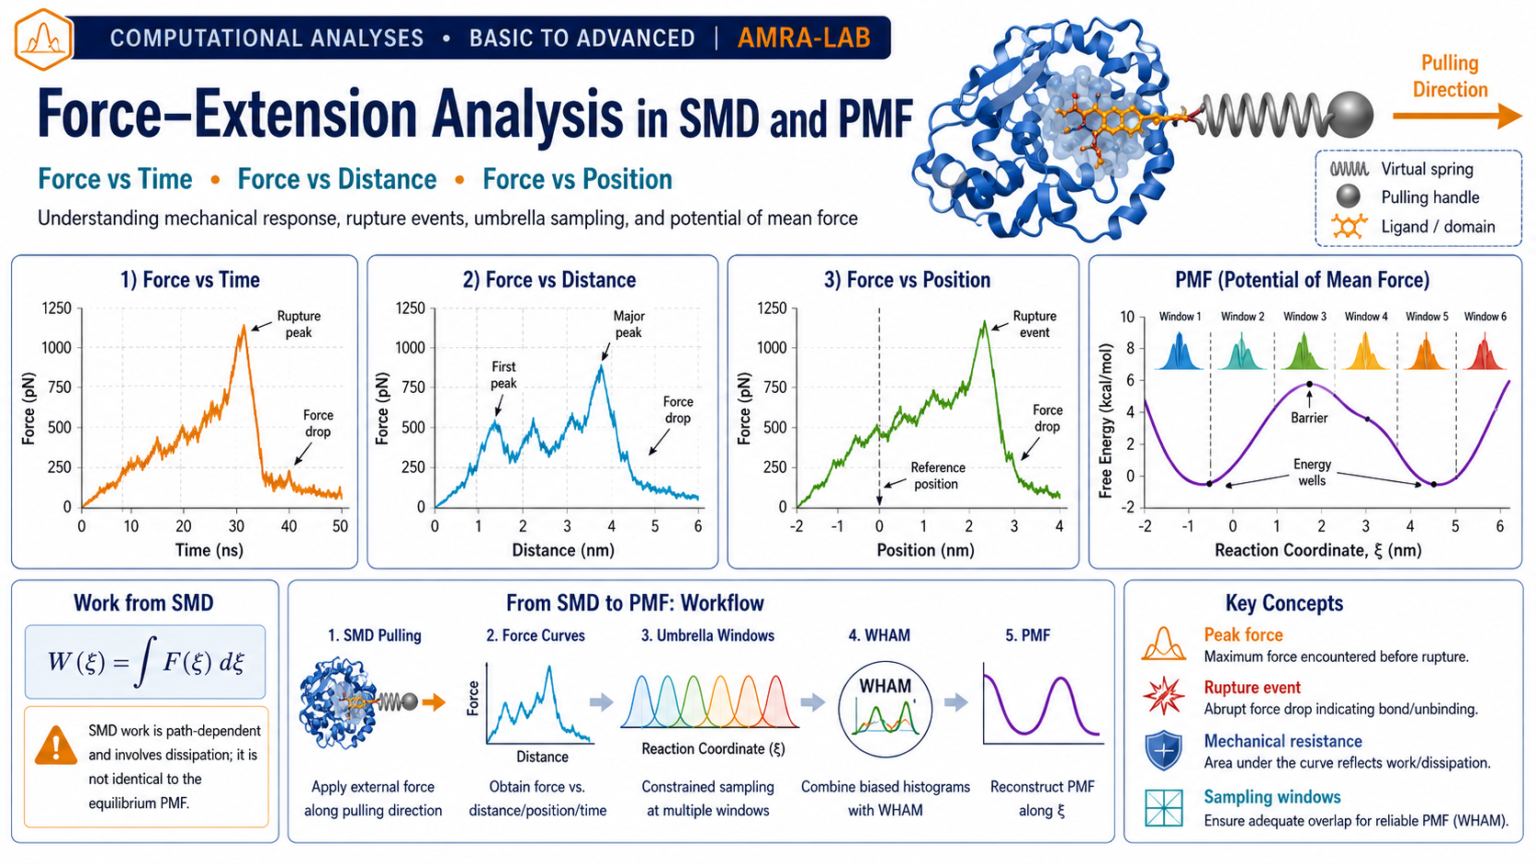
A complete guide to Force vs Time, Force vs Distance, Force vs Position, work interpretation, umbrella-window selection, and potential of mean force analysis.
Shows when resistance, rupture, rearrangement, or relaxation occurs during the pulling trajectory.
Connects mechanical resistance directly to extension or separation and supports work calculation.
Maps force onto the reaction coordinate and helps choose umbrella-sampling windows.
Steered molecular dynamics applies an external bias to move a selected group along a defined collective variable or reaction coordinate.
In constant-velocity pulling, a virtual spring moves at a prescribed speed. The molecular system may lag behind that moving reference because of binding contacts, steric barriers, solvent resistance, protein deformation, membrane resistance, or internal rearrangement. The spring extension produces the recorded pulling force.
Reaction coordinate ξ may be a distance, projection along a direction, angle, dihedral, or another supported collective variable. In ligand unbinding it is often the separation between ligand and protein reference groups.
Choose a reference group and a pulled group, such as protein and ligand, two domains, peptide and membrane, or receptor and substrate.
Select distance, direction, direction-periodic, cylinder, angle, or another suitable geometry, including the active dimensions.
The restraint centre advances at pull rate v so the target coordinate is ξref(t)=ξ0+vt.
The current molecular coordinate ξ(t) usually does not perfectly follow the moving target.
For a harmonic spring, the force is related to the difference between the moving reference and current coordinate, with sign determined by the program convention.
GROMACS can write pull-force and pull-coordinate data during the simulation for later analysis.
Force is plotted against simulation time, normally in picoseconds or nanoseconds.
This plot places force against extension, separation, or displacement rather than time.
Force vs distance reveals where along the mechanical extension the system resisted pulling. It is especially useful for ligand unbinding, domain separation, membrane permeation, peptide detachment, protein unfolding, and rupture of macromolecular contacts.
Force vs position maps the force directly onto the collective variable ξ. For a straight directional pull, the x-, y-, or z-projected coordinate may be used. For a distance geometry, the reaction coordinate may simply be group separation.
This representation is valuable for choosing umbrella-sampling windows because it shows coordinate regions where resistance changes, structural transitions occur, or denser window spacing may be necessary.
Scalar COM separation between two groups. Common in ligand unbinding and domain separation.
Motion along selected dimensions or a user-defined vector, useful for channels and membranes.
May include angles, dihedrals, or other collective variables depending on the pulling setup.
W(ξ) = ∫ F(ξ) dξ
The signed area under a force–coordinate curve gives the mechanical work performed by the pulling force along that path. In discrete data, work is often estimated numerically with a trapezoidal integration.
Change pulling speed and rupture position to see how the plots respond. This is a teaching model, not real simulation data.
Use this representation to identify when force loading, major rupture, and post-rupture relaxation occur.
The system is being mechanically loaded. Contacts, steric constraints, solvent drag, or structural deformation may resist displacement.
Often indicates rupture of a dominant contact network, pocket escape, unfolding event, or passage through a narrow barrier.
May represent stepwise contact rupture, intermediate states, repeated stick–slip behavior, or movement through multiple constrictions.
May reflect distributed resistance, dynamic reformation of contacts, strong thermal noise, or an overly stiff/fast pulling protocol.
Can occur because force is signed relative to the chosen coordinate or direction. Check sign convention, pull geometry, and whether absolute magnitude or signed force is scientifically relevant.
pull                     = yes
pull-ngroups             = 2
pull-ncoords             = 1
pull-group1-name         = Protein
pull-group2-name         = Ligand
pull-coord1-type         = umbrella
pull-coord1-geometry     = direction
pull-coord1-dim          = N N Y
pull-coord1-groups       = 1 2
pull-coord1-vec          = 0 0 1
pull-coord1-start        = yes
pull-coord1-rate         = 0.001
pull-coord1-k            = 1000
pull-nstxout             = 100
pull-nstfout             = 100
Values are examples only. Geometry, dimensions, rate, force constant, reference groups, PBC handling, and direction must be designed for the system.
gmx grompp -f md_pull.mdp -c npt.gro -r npt.gro -p topol.top -n index.ndx -o pull.tpr
gmx mdrun -deffnm pull -pf pullf.xvg -px pullx.xvg
# Prepare text files listing window inputs
# tpr-files.dat  -> one umbrella .tpr path per line
# pullf-files.dat or pullx-files.dat -> matching output files

gmx wham -it tpr-files.dat -if pullf-files.dat -o pmf.xvg -hist histo.xvg -bsres bsResult.xvg -bsprof bsProfs.xvg
Exact options depend on GROMACS version and input mode. Inspect histogram overlap, discard equilibration appropriately, and use bootstrap or block analysis for uncertainty.
A nonequilibrium force curve and an equilibrium free-energy profile are different quantities. PMF requires appropriate sampling and reweighting.
Higher pulling rates often increase dissipative force and work. Compare only matched protocols or explicitly study rate dependence.
Thermal fluctuations and path dependence can strongly affect peak force. Independent replicates are essential for reliable comparison.
A different vector can create a different steric pathway, contact sequence, and rupture force.
Smoothing may hide transient rupture peaks. Report the method and retain raw data.
Insufficient overlap produces unreliable PMF regions even if the final curve looks smooth.
A dissociation PMF may need geometric, restraint, Jacobian, and standard-state treatment before it can support a quantitative binding free energy.
“Constant-velocity steered molecular dynamics was performed along a defined protein–ligand separation coordinate using a harmonic pulling restraint. Pulling force and coordinate were recorded throughout the trajectory, and Force–Time and Force–Distance profiles were analyzed across independent replicates. Representative configurations were subsequently used to initialize umbrella-sampling windows for WHAM-based PMF reconstruction.”
Force vs Time tells you when resistance changes; Force vs Distance tells you where mechanical resistance occurs and supports work integration; Force vs Position maps resistance onto the reaction coordinate and guides umbrella-window selection. None of these SMD plots should automatically be treated as an equilibrium PMF.
Educational content for AMRA-LAB Computational Analyses · SMD Force and PMF module