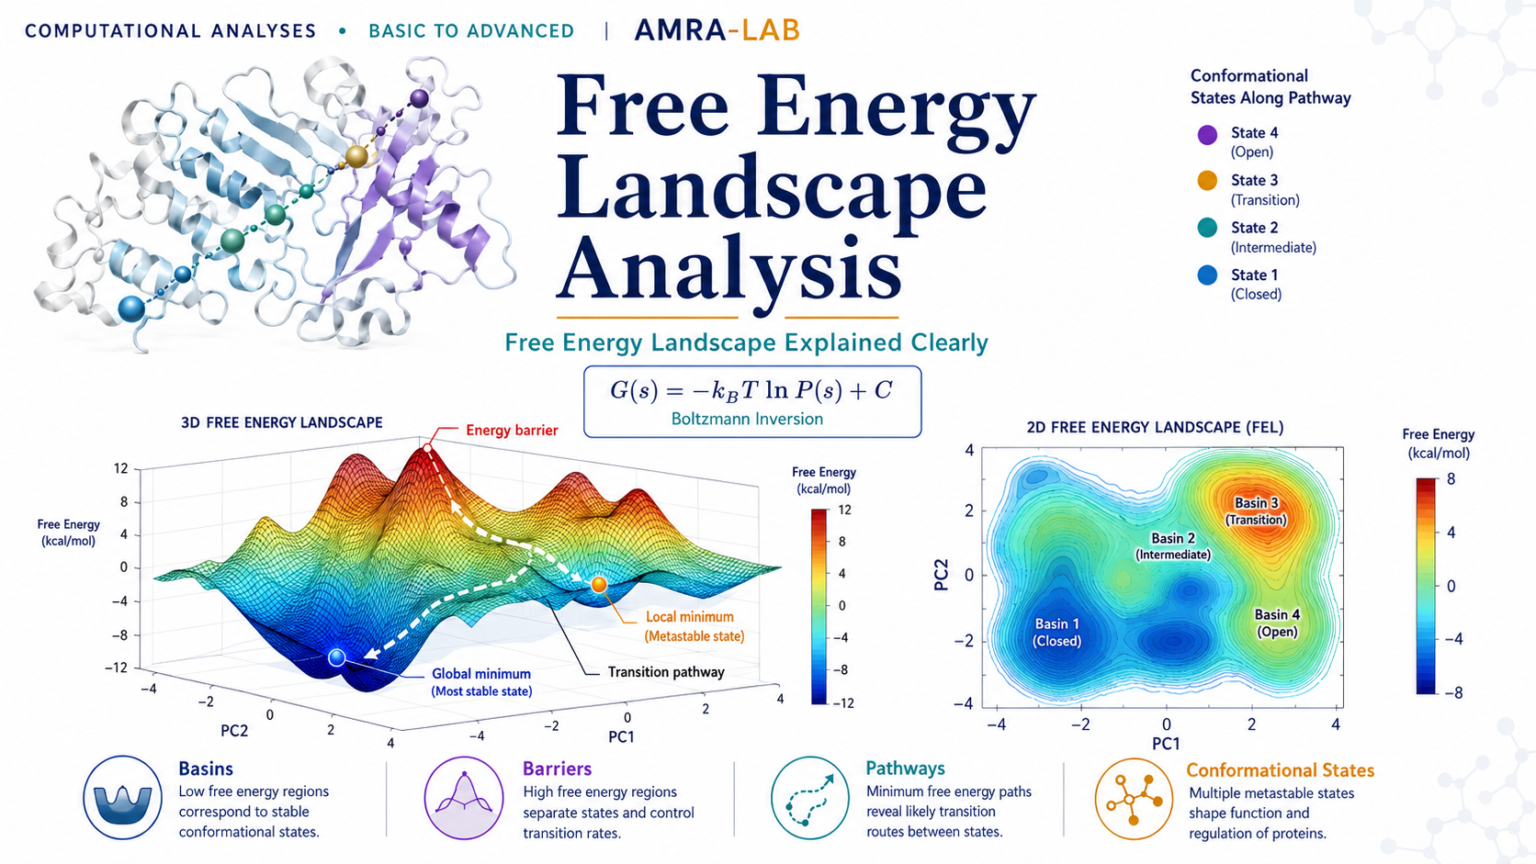
Computational Analyses · Basic to Advanced | AMRA-LAB
Free Energy Landscape Explained Clearly
How conformational populations become free-energy basins, how reaction coordinates shape the map, how minima and barriers are interpreted, how PCA-based landscapes are generated, and where free-energy landscape analysis can mislead you.
Frequently visited conformations appear as low-energy basins after Boltzmann inversion.
02
Coordinates define the map
The landscape depends completely on the reaction coordinates or collective variables selected.
03
Relative, not absolute
Most MD-derived FEL plots show relative free energy within the sampled ensemble.
Foundation
1. What is a Free Energy Landscape?
A free energy landscape (FEL) is a map that organizes sampled molecular conformations according to selected coordinates and their relative free energy.
Simple definition
During molecular dynamics, a protein or complex visits many conformations. When these conformations are projected onto one or two reaction coordinates, their probabilities can be converted into a relative free-energy surface.
Deep valleys or basins represent highly populated conformational states. High regions or ridges represent rarely sampled states or barriers between states.
বাংলায় সহজ করে: MD simulation-এ molecule যেসব conformation বেশি সময় নেয়, সেগুলো FEL-এ নিচু basin হিসেবে দেখা যায়। কম sampled বা transition region উঁচু energy area হিসেবে দেখা যায়।
Important: An FEL is only as informative as the sampling and the selected coordinates. A beautiful surface can still be misleading if the trajectory is short or the coordinates hide important motions.
Purpose
2. Why is FEL analysis important?
◉
Identify metastable states
Low-energy basins can reveal dominant conformational states sampled by the system.
বাংলা: প্রধান stable বা metastable state খুঁজে পাওয়া যায়।
↗
Visualize transitions
Ridges and connecting regions can suggest pathways between conformational basins.
বাংলা: এক state থেকে অন্য state-এ যাওয়ার সম্ভাব্য পথ বোঝা যায়।
⌘
Compare systems
Apo/bound, wild-type/mutant, or different ligands can be compared using identical coordinates and analysis settings.
বাংলা: একই coordinate ও settings ব্যবহার করলে বিভিন্ন system compare করা যায়।
Typical applications
Protein folding and unfolding studies.
Ligand-induced conformational changes.
Open versus closed pocket states.
Domain motion and allosteric transitions.
Comparison of mutants or ligand complexes.
Selection of representative structures from major basins.
Thermodynamic basis
3. How is probability converted into free energy?
Boltzmann inversion
The relative free energy at coordinate value s is commonly calculated as:
G(s) = −kBT ln P(s) + C
P(s): probability of observing a state or histogram bin.
kB: Boltzmann constant.
T: absolute temperature.
C: arbitrary constant used to set the minimum to zero.
বাংলা: যে state বেশি পাওয়া যায় তার probability বেশি, তাই তার relative free energy কম হয়। যে state কম পাওয়া যায় তার energy বেশি দেখায়।
Zero probability problem: Empty histogram bins cannot be directly converted because ln(0) is undefined. Tools handle such bins with cutoffs, maximum-energy values, or omission.
Interactive learning
4. Explore an interactive free-energy landscape
Change temperature, sampling sharpness, and barrier height to see how populations become energy basins.
2D topographic FEL
Dark blue/purple regions are low-energy basins; warm colors are higher-energy regions.
বাংলা: Dark basin বেশি populated state বোঝায়। Barrier বাড়ালে basin-গুলোর মধ্যে transition কঠিন হয়। Temperature বাড়ালে population distribution তুলনামূলকভাবে ছড়িয়ে যেতে পারে।
Live probability-to-energy calculator
See why high population gives low relative free energy.
Boltzmann inversion
ΔG = −RT ln(P/Pmax)
The most populated state is assigned 0 relative energy. Less populated states receive positive relative free energy.
0.40P/Pmax
−0.92ln(P/Pmax)
2.29ΔG (kJ/mol)
Interpretation
This state is less populated than the dominant state, so it lies at higher relative free energy.
Population
Relative probability
Relative free energy
বাংলা: Population যত কম, dominant state-এর তুলনায় relative free energy তত বেশি হবে।
Coordinate choice
5. Which reaction coordinates should be used?
The landscape is a projection. Choosing meaningful coordinates is one of the most important scientific decisions.
Principal components PC1 and PC2
Often used to describe dominant collective motions. Useful for broad conformational changes, but the first two PCs may not represent the slowest thermodynamic coordinates.
বাংলা: PC1 ও PC2 বড় collective motion দেখায়, কিন্তু সবসময় best reaction coordinate নয়।
RMSD and Radius of Gyration
Useful for folding, collapse, or overall deviation studies. However, different conformations can share similar RMSD or Rg values.
বাংলা: Folding বা compaction বোঝাতে useful, কিন্তু distinct state overlap করতে পারে।
Inter-residue or ligand–protein distance
Useful for domain closure, salt-bridge formation, ligand entry/exit, or contact-state transitions.
বাংলা: Distance-based coordinate specific molecular event বোঝাতে ভালো।
Dihedral angles
Backbone or side-chain dihedrals can distinguish rotameric or folding states that Cartesian coordinates may hide.
বাংলা: Torsional state পরিবর্তন ধরতে dihedral coordinate useful।
Native contacts or coordination number
Useful for folding, binding, oligomerization, and interface formation.
বাংলা: Contact formation বা loss বোঝায়।
Collective variables from enhanced sampling
Umbrella sampling, metadynamics, and AWH often define explicit collective variables. The resulting surface may require bias removal or reweighting.
বাংলা: Enhanced sampling data-তে bias correction ছাড়া FEL ভুল হতে পারে।
Best practice: Use coordinates that separate the physical states relevant to your biological question. Test multiple coordinate pairs when possible.
PCA-based workflow
6. How is a PC1–PC2 landscape generated?
Prepare a clean trajectory
Remove periodic-boundary artifacts, center the molecule, and fit frames consistently.
বাংলা: PBC correction ও fitting আগে করতে হবে।
Build the covariance matrix
Select a meaningful atom group, commonly Cα or backbone atoms, then calculate coordinate fluctuations.
বাংলা: Selected atom-এর fluctuation থেকে covariance matrix তৈরি হয়।
Diagonalize the covariance matrix
Eigenvectors describe collective directions of motion; eigenvalues describe variance along those directions.
বাংলা: Eigenvector motion direction এবং eigenvalue motion magnitude বোঝায়।
Project the trajectory
Each frame is projected onto PC1 and PC2 to generate two coordinates per frame.
বাংলা: প্রতিটি frame-এর PC1 ও PC2 value পাওয়া যায়।
Build a 2D histogram
Frames are counted within PC1–PC2 bins to estimate probability.
বাংলা: Bin-এ frame count থেকে probability বের হয়।
Boltzmann-invert the histogram
Probability is converted to relative free energy and the minimum is usually shifted to zero.
বাংলা: Probability থেকে relative energy landscape তৈরি হয়।
Reading the map
7. How should FEL basins and barriers be interpreted?
Low-energy basins
Highly populated states within the analyzed trajectory.
Possible metastable conformational ensembles.
Candidate regions for representative structure extraction.
Not automatically the experimentally correct state.
High-energy regions and barriers
Low-population regions or transitions.
Possible separation between metastable basins.
Barrier height in a projected FEL is not always a kinetic activation free energy.
Poor sampling can create artificial empty ridges.
Common landscape patterns
One deep basin: one dominant sampled ensemble.
Several separated basins: multiple metastable conformational states.
Broad shallow basin: conformational heterogeneity or flexible sampling.
Narrow deep basin: concentrated population around a restricted coordinate region.
Connected valleys: possible transition channels in the selected coordinate projection.
বাংলায় সহজ করে: Basin-এর number, depth, width, এবং connectivity system-এর sampled states সম্পর্কে ধারণা দেয়, তবে kinetics বা true stability প্রমাণ করে না।
Representative structures
8. How are structures extracted from FEL basins?
Define the coordinate range of a basin.
Identify trajectory frames whose coordinates fall inside that range.
Extract one central frame, the lowest-bin frame, or several representative frames.
Cluster frames within the basin when the basin is broad.
Compare structures using RMSD, contacts, secondary structure, ligand pose, or other targeted analyses.
বাংলা: Basin-এর PC বা reaction-coordinate range থেকে frame select করে structure extract করা হয়। Broad basin হলে clustering করা ভালো।
Do not call a single extracted frame “the basin structure” without qualification: a basin is an ensemble, not necessarily one unique conformation.
Reliability
9. Sampling and convergence requirements
Checks that improve confidence
Compare first-half and second-half landscapes.
Construct block-wise landscapes.
Analyze independent replicate simulations.
Check whether basin populations stabilize.
Use consistent bins and coordinate ranges across comparisons.
Inspect whether new basins keep appearing late in the trajectory.
Warning signs
Landscape changes dramatically with small bin-size changes.
Most bins have very few frames.
Replicates produce unrelated landscapes.
Only one directional transition is observed.
Enhanced-sampling bias is ignored.
PC spaces from different systems are compared without a common basis.
বাংলায় সহজ করে: FEL reliable করতে long sampling, block comparison, replicate, এবং stable basin population দরকার। শুধু সুন্দর plot যথেষ্ট নয়।
Interpretation safety
10. Common mistakes
Calling the lowest basin the globally stable structure
It is only the most populated region within the sampled data and chosen projection.
বাংলা: Lowest basin sampled trajectory-এর মধ্যে dominant, পুরো physical universe-এর global minimum নয়।
Using arbitrary coordinates because they produce a nice plot
Coordinates must be scientifically connected to the process being studied.
PC1 and PC2 from different covariance matrices are not guaranteed to represent the same motions. Use a common covariance basis or combined trajectory when appropriate.
বাংলা: আলাদা PCA-এর PC1/PC2 সরাসরি equivalent নাও হতে পারে।
Ignoring bin size
Very fine bins create noise and empty regions; very coarse bins hide states and barriers.
বাংলা: Bin খুব ছোট বা খুব বড় হলে landscape misleading হতে পারে।
Interpreting projected barriers as exact kinetics
A 2D projected barrier may hide orthogonal pathways and generally does not provide a reliable rate constant by itself.
বাংলা: 2D barrier থেকে সরাসরি kinetic rate বলা ঠিক নয়।
Ignoring reweighting for biased simulations
Metadynamics, umbrella sampling, AWH, and other biased methods require the correct reconstruction or reweighting method.
বাংলা: Biased simulation-এ reweighting ছাড়া FEL ভুল হবে।
For a conventional PC1–PC2 Gibbs landscape, the key output is usually -ls. Enthalpy and entropy outputs require appropriate energy input and careful interpretation.
5. Convert the XPM map for plotting
gmx xpm2ps -f gibbs.xpm -o gibbs.eps
Many researchers instead parse the XPM matrix with Python, R, MATLAB, or dedicated plotting scripts for publication-quality contour and 3D surfaces.
Command caution: Exact prompts, file formats, and optimal options depend on your GROMACS version, trajectory, selected coordinates, temperature, and binning strategy. Inspect the current command help before production analysis.
Publication practice
12. What should be reported?
Software and version used.
Trajectory length and analyzed time range.
PBC correction and fitting procedure.
Atoms used for covariance or coordinate calculation.
Reaction coordinates or collective variables.
Whether PCA used a common or separate basis.
Temperature used in Boltzmann inversion.
Histogram bin number or bin width.
Energy unit and zero-reference convention.
Treatment of empty bins and maximum energy.
Bias correction or reweighting method, when applicable.
Convergence and replicate checks.
Example reporting sentence
“The production trajectory was projected onto the first two principal components obtained from the Cα covariance matrix. A two-dimensional histogram of PC1 and PC2 populations was converted into a relative Gibbs free-energy landscape using Boltzmann inversion at 300 K, with the global minimum shifted to 0 kJ mol⁻¹.”
বাংলা: Method section-এ coordinate, atom selection, temperature, binning, time range, এবং zero-energy reference পরিষ্কারভাবে লিখতে হবে।
Frequently asked questions
13. FEL FAQ
Is a free-energy landscape the same as a potential-energy surface?
No. A free-energy landscape includes statistical and entropic effects along selected coordinates, whereas a potential-energy surface describes potential energy as a function of coordinates.
বাংলা: FEL এবং potential energy surface এক জিনিস নয়।
Does the deepest basin prove the native state?
No. It is the most populated state in the analyzed sample and projection. Experimental validation and broader sampling are needed.
বাংলা: Deepest basin native state-এর চূড়ান্ত প্রমাণ নয়।
Can RMSD and Rg be used instead of PCA?
Yes, when they meaningfully describe the process. They may, however, merge distinct conformations into the same coordinate region.
বাংলা: ব্যবহার করা যায়, কিন্তু distinct state overlap করতে পারে।
How many basins should a good FEL have?
There is no correct number. Basin number depends on the molecule, coordinates, sampling, and binning.
বাংলা: Basin-এর কোনো fixed ideal number নেই।
Can one trajectory prove convergence?
Usually not strongly. Block analysis and independent replicates provide better evidence.
বাংলা: এক trajectory-এর FEL দিয়ে strong convergence claim করা ঠিক নয়।
Why does my landscape change when I change bins?
Binning controls resolution and statistical noise. Stable conclusions should not depend strongly on a small, reasonable change in bin width.
বাংলা: Bin size resolution ও noise বদলায়।
Final interpretation rule
A free energy landscape is a probability-derived projection of sampled conformations onto selected coordinates. Its basins, barriers, and pathways are meaningful only when the sampling, coordinate choice, binning, and statistical treatment are appropriate.
বাংলায় মূল কথা: FEL system-এর conformational state ও population বুঝতে শক্তিশালী analysis, কিন্তু beautiful color map দেখেই conclusion দেওয়া যাবে না। Sampling, coordinate, replicate, convergence এবং representative structure analysis একসাথে দরকার।
Educational content for AMRA-LAB Computational Analyses · Free Energy Landscape module